# 1.6 matplotlib
import numpy as np
import matplotlib.pyplot as plt # 그래프를 그리려면 pyplot 모듈을 이용
# 데이터 준비
x = np.arange(0, 6, 0.1) # 0에서 6까지 0.1 간격으로 생성
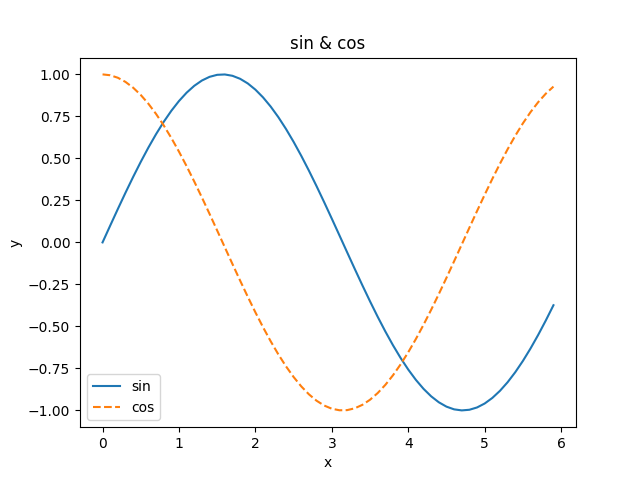
y1 = np.sin(x) # sine 함수
y2 = np.cos(x)
# 그래프 그리기
plt.plot(x, y1, label='sin')
plt.plot(x, y2, linestyle="--", label="cos") # cos 함수는 점선으로 그리기
plt.xlabel("x") # x축 이름
plt.ylabel("y") # y축 이름
plt.title('sin & cos') # 제목
plt.legend() # 범례 추가
plt.show()
# 이미지 표시하기
from matplotlib.image import imread
img = imread('image.png')   # 경로에 image.png가 있어야 한다.
plt.imshow(img)
plt.show()